VMware Log Analysis for Troubleshooting
VMware server software products provide log files that record data about events of each software component with timestamps. VMware logs can be used for troubleshooting and to diagnose and resolve issues. This blog post covers ESXi and vCenter logs, explains how to check logs in VMware vSphere, how to find the needed information, and analyze them.
ESXi Logs
VMware ESXi is a widely used hypervisor that allows users to create and manage virtual machines on physical servers. To ensure proper functioning, troubleshooting, and monitoring of ESXi servers, various logs are generated. These logs capture important events, errors, and performance data, helping administrators and support teams identify issues and maintain the stability of the virtual infrastructure. Below is an explanation of some essential VMware ESXi logs.
VMkernel logs
/var/log/vmkernel.log
This log records VMkernel activities, including device driver events, storage, networking, and other kernel-related activities. It provides insights into low-level system operations and is crucial for diagnosing hardware-related issues. The vmkernel log location is the /var/log/ directory.
/var/log/vmkwarning.log
This log file contains warning messages generated by the VMkernel, which is the core of the ESXi hypervisor. It records events and conditions that may require attention but are not critical errors.
/var/log/vmksummary.log
The vmksummary.log is a summary log that provides an overview of the ESXi host’s operational state, including startup and shutdown events, system resource usage, and some key performance statistics.
Host management logs
/var/log/hostd.log
This log contains entries related to the ESXi host management service (hostd). It captures events related to virtual machine power operations, task and event processing, and communication with the vCenter Server if applicable.
Virtual machine logs
/vmfs/volumes/datastore_name/vm_name/vmware.log
Each virtual machine maintains a log file capturing events specific to that VM, such as power operations, virtual hardware changes, and application events from within the guest OS. The vmware.log file location is a VM directory on a datastore.

Storage logs
/var/log/vobd.log
This log focuses on issues related to storage and iSCSI operations.
/var/log/vmkernel.log
As mentioned earlier, VMkernel logs also capture storage-related events.
Network logs
/var/log/vobd.log
This log includes network-related events, such as vMotion, network connectivity, and communication errors.
/var/log/vmkernel.log
VMkernel logs also contain network-related messages.
Authentication and user logs
/var/log/auth.log
This log records authentication events, including user logins and logouts.
ESXi shell and SSH logs
/var/log/shell.log
This log captures ESXi Shell (TSM) commands executed by users.
/var/log/ssh.log
If SSH is enabled on the ESXi host, this log records SSH-related events.
System messages
/var/log/syslog.log
The syslog.log contains a comprehensive log of system messages from the VMkernel and various services running on the ESXi host. It captures a wide range of information, including boot messages, hardware events, network activities, and more.
Firewall logs
/var/log/firewall.log
This log tracks events related to the ESXi firewall, including allowed and denied connections.
vCenter server logs on ESXi (if connected to a vCenter Server)
/var/log/vpxa.log
This log file is specific to ESXi hosts managed by the vCenter Server. The vpxa.log is related to the vCenter Agent (vpxa) running on the ESXi host. It records interactions between the ESXi host and the vCenter Server, including tasks initiated from vCenter, such as VM power operations, migrations, and configuration changes, as well as host status updates, task and event execution, and communication with the vCenter Server.
ESXi update logs
/var/log/esxupdate.log
The esxupdate.log contains logs related to ESXi host patching and updates. This log file records information about the installation, upgrade, and removal of software packages (VIBs) on the ESXi host.
USB logs
/var/log/usb.log
The usb.log file records events related to USB devices connected to the ESXi host. It tracks the detection, connection, and disconnection of USB devices, as well as any issues related to USB passthrough or usage of a USB arbitrator service.
VMware vCenter Logs
VMware vCenter is a centralized management platform that allows administrators to efficiently manage multiple VMware ESXi hosts and virtual machines. To maintain the health and performance of the vCenter Server and the ESXi hosts connected to it, several logs are generated, each serving a specific purpose. Below is the explanation of some essential VMware vCenter logs.
vpxd.log
Location: /var/log/vmware/vpxd/vpxd.log
This log file records events related to the vCenter Server service and the vpxd log location is the /var/log/vmware/vpxd/ directory on a vCenter server. The vpxd log contains information about vCenter service startup, connection events from vSphere clients, user authentication, licensing, and various administrative tasks performed through the vSphere client or API.
/var/log/vmware/vpxd/vpxd-alert.log contains non-critical information about the vpxd process.
fdm.log
Location: /var/log/fdm.log
The Fault Domain Manager (FDM) log is critical for vSphere High Availability (HA) troubleshooting. It contains information about host and VM failures, HA configuration, heartbeat data, and the election of the master host in an HA cluster.
vmsyslogd.log
Location: /var/log/vmware/vmsyslogd.log
This log file is related to the syslog service running on the vCenter Server Appliance. It records messages forwarded to the vCenter Servers syslog from various components and services.
vmware-vpostgres.log
Location: /var/log/vmware/vpostgres/postgresql-xx.log
This log contains detailed PostgreSQL database-related messages, including replication status, transaction logs, and other database events.
catalina.log
Location: /var/log/vmware/vpostgres/catalina.out
This log file belongs to the VMware Postgres database service. It contains messages related to database operations, including startup and shutdown events, queries, and errors.
sms.log
Location: /var/log/vmware/sms/sms.log
The Storage Monitoring Service (SMS) log records events related to storage monitoring and management tasks, including datastores, storage devices, and storage alarms.
invsvc.log
Location: /var/log/vmware/invsvc/invsvc.log
The Inventory Service log contains information about vCenter Server inventory operations, such as object updates, data collection, and synchronization.
applmgmt.log
Location: /var/log/vmware/applmgmt/applmgmt.log
This log file is related to the appliance management service and provides information about the deployment and configuration of the vCenter Server Appliance.
vmware-sts-idmd.log
Location: /var/log/vmware/sso/vmware-sts-idmd.log
This log records events related to the VMware Single Sign-On (SSO) service, identity management, and authentication processes.
stats.log
Location: /var/log/vmware/perfcharts/stats.log
The stats.log file is associated with the vCenter Server Performance Charts service (also known as vCenter Performance Charts). It contains statistical data and performance-related information collected by the Performance Charts service.
The Performance Charts service provides graphical representations of performance metrics for virtual machines and hosts. The stats.log records data that can be used to generate performance charts and graphs for monitoring and analyzing the performance of virtual infrastructure components.
NOTE: The Performance Charts service is essential for monitoring the real-time performance of VMs and hosts, and the stats.log plays a role in storing the underlying data.
eam.log
Location: /var/log/vmware/eam/eam.log
The eam.log file belongs to the ESX Agent Manager (EAM) service in vCenter Server. EAM is responsible for managing vSphere agents, including vSphere Installation Bundles (VIBs) and extension agents.
The eam.log records events and activities related to the lifecycle management of vSphere agents. It stores information about agent deployments, upgrades, and validations. If you are looking for VMware Lifecycle Manager log location, check /var/log/vmware/eam/eam.log
NOTE: The ESX Agent Manager ensures that the correct versions of VIBs are installed on ESXi hosts and that extension agents are correctly registered. The eam.log is instrumental in tracking these operations and detecting any issues related to vSphere agents.
Where Logs Are Stored
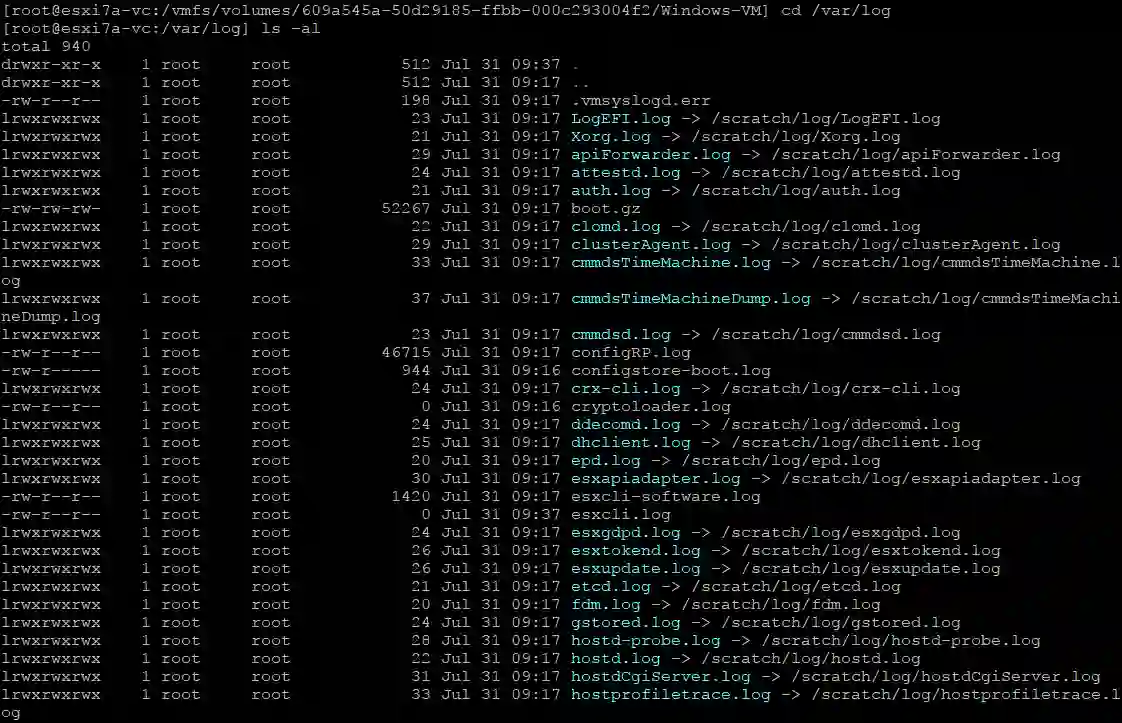
Let’s find out on which partition and in which directories VMware logs are stored. In a default VMware ESXi installation, logs are stored in several directories on different partitions. The typical location of VMware logs, such as VMkernel logs on an ESXi host, is:
/scratch/log/

Symlinks are located in /var/log/ but log files are stored on an ESXi scratch partition (see the screenshots above and below). We covered the scratch partition and temporary storage when we explained how to install ESXi on a USB flash drive.
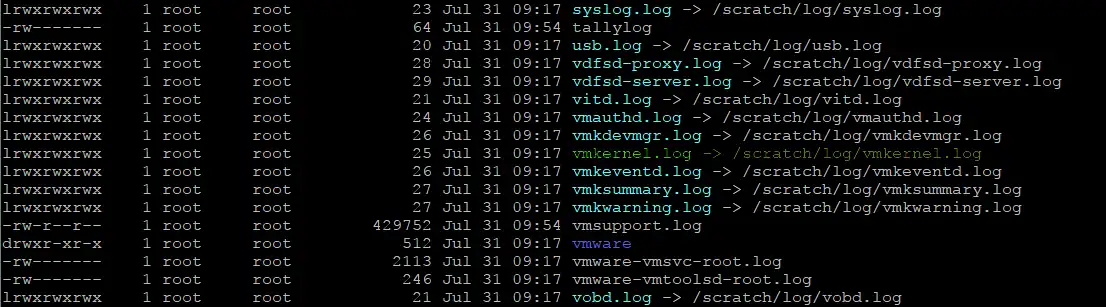
For example, you can access Host Management Logs in /var/log/hostd.log using the symlink (symbolic link), but the hostd.log file is located in the log directory in the /scratch partition.
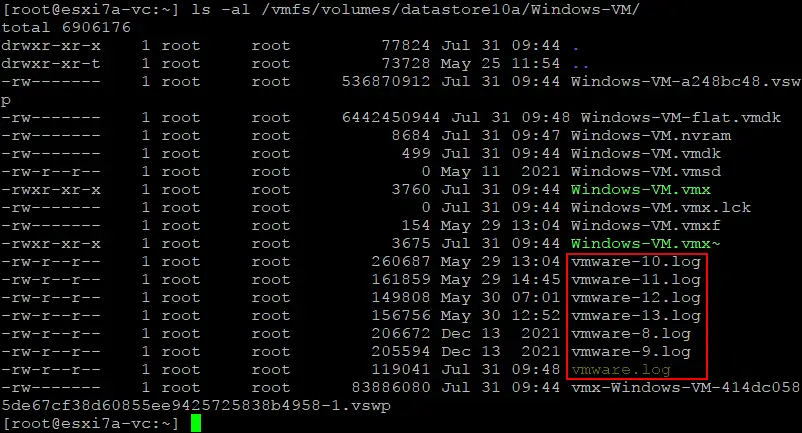
Virtual Machine Logs are usually located on a VM datastore in the VM directory and are not deleted after ESXi server reboot, for example: /vmfs/volumes/datastore_name/vm_name/vmware.log
When a VM log file (vmware.log) is full, it is renamed to vmware-1.log, vmware-2.log, etc.
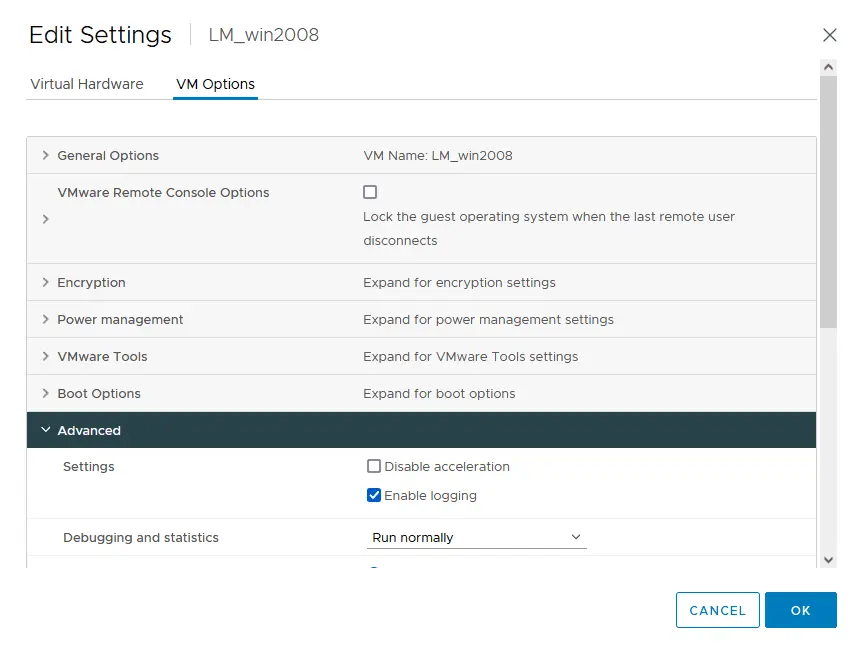
You can enable or disable VM logs by going to VM settings > VM options in VMware vSphere Client and expanding the Advanced options, which include the Enable logging checkbox.
Thus, the /scratch partition is used for storing logs and other temporary files on an ESXi host. In some installations, the /scratch partition is configured as an in-memory file system (tmpfs). If you need to preserve logs across reboots, you can configure a persistent storage location for logs using the “esxcli system syslog” command and other commands explained below.
Keep in mind that the locations of ESXi logs might vary depending on the ESXi version and configuration. Additionally, logs might be stored on a persistent storage device if configured explicitly by the system administrator.
Location of vCenter logs
Most vCenter Server logs are located in the /var/log/vmware/ directory. VMware vCenter Server does not store logs on a temporary (non-persistent) partition like ESXi. Instead, vCenter Server logs are typically stored on the operating system’s local disk or a mounted storage volume, which means they are persistent across reboots. VMware vCenter Server Appliance (VCSA) is based on Photon Linux, as we remember and VCSA is the newest vCenter deployment approach used in the latest vSphere versions.
The location of vCenter logs for the Linux-based installation (VCSA) is:
/var/log/vmware/vpx/
The exact location of the vCenter logs depends on the operating system on which vCenter Server is installed. Windows-based vCenter Server, which was used up to VMware vSphere 6.7 and is deprecated, used the following default location to store VMware vCenter logs:
C:\ProgramData\VMware\vCenterServer\logs\
Note that the vCenter log locations may vary depending on the vCenter Server version and configuration. You can always refer to the official VMware documentation or the specific vCenter Server version’s documentation to find the exact log locations.
Since vCenter Server is a central management platform, it relies on persistent logs to maintain historical information and facilitate troubleshooting and performance analysis over time. Unlike ESXi, which uses an in-memory file system for temporary logs (for some default configurations), vCenter Server logs are designed to be persistent and are stored on a permanent storage device. As for non-persistent storage for ESXi logs, you can change the log storage location on ESXi.
How to Access VMware Logs
We have explored what VMware logs are and where they are stored. Now we have to find out how to check VMware ESXi logs to perform for further analysis. You can access VMware ESXi logs in different ways.
VMware Host Client
Perform the following steps to view ESXi logs in VMware Host Client:
- Log in to VMware Host Client in your web browser.
- Click Host > Monitor in the Navigator pane and hit the Logs tab.
- Select one of the ESXi logs to view the logged information. You can search the needed string by using a Search field.

DCUI (ESXi)
You can use the direct console user interface on ESXi to view logs. You need physical access to an ESXi host, including a monitor and keyboard or you can use a KVM switch and similar technologies.
- Log in to the ESXi direct console user interface (DCUI).
- Select the View System Logs entry in the System Customization menu.
- Press a key from 1 to 6 to view the appropriate VMware log on your ESXi server. The explanation for each digit is displayed in the right pane of the interface.

- After you enter the needed digit, you see a full-screen page with logs. You can type / and enter a search string to display only lines with the needed information. Press q to quit this mode and go back to the previous DCUI menu.

Web browser
Use a link in a web browser to open a page with links to download log files. You must enter your credentials with administrative permissions for the ESXi host to access this page.
https://<ESXI_host_IP>/host

ESXi command line
The ESXi command line, similar to DCUI, can be used to view ESXi logs if the network connection is unavailable and you cannot use methods to view logs remotely via the network.
- Ensure that ESXi Shell is enabled in DCUI (Troubleshooting Options > Enable ESXi Shell).
- Press Alt+F1 to open the ESXi shell.
- Use commands to view ESXi logs.
SSH
Remote SSH access is one of the most convenient and powerful methods to view and analyze VMware logs.
- Enable SSH in DCUI (Troubleshooting Options > Enable SSH) or VMware Host Client to allow remote SSH access to an ESXi host.
- Connect to the ESXi host using an SSH client (for example, PuTTY if connecting from Windows).
- Use commands to view ESXi logs and for VMware log analysis.
VMware Log Analysis with Examples
Now we know the names and locations of VMware logs as well as methods to access logs that are invaluable for troubleshooting various issues in a virtualized environment. It’s time to explore some practical examples of how to use VMware logs for troubleshooting.
Identifying ESXi host connectivity issues
Problem: Virtual machines on an ESXi host are experiencing intermittent network connectivity problems.
Logs to check:
- /var/log/vmkernel.log
- /var/log/vobd.log
- /var/log/hostd.log
Troubleshooting steps. Check the VMkernel logs for network-related messages and look for errors or dropped packets. Also, review the hostd logs for any host management service issues. The vobd.log can provide insight into storage-related problems that might be affecting VM networking.
VM snapshot creation failure
Problem: The attempt to create a snapshot of a virtual machine fails.
Logs to check:
- /vmfs/volumes/datastore_name/vm_name/vmware.log
- /var/log/vmkernel.log
Troubleshooting steps. Examine the vmware.log of the specific virtual machine for snapshot-related errors or warning messages. Concurrently, check the VMkernel logs for storage-related issues that might prevent the snapshot operation.
VM performance degradation
Problem: A virtual machine is experiencing performance issues, such as high CPU or memory usage.
Logs to check:
- /vmfs/volumes/datastore_name/vm_name/vmware.log
- /var/log/vmkernel.log
Troubleshooting steps. Analyze the vmware.log of the affected VM for any application-specific errors or resource utilization spikes. Simultaneously, check the VMkernel logs for performance-related messages and ensure that the ESXi host has sufficient resources available.
vCenter service startup failure
Problem: The vCenter Server service fails to start.
Logs to check:
- /var/log/vmware/vpxd/vpxd.log on vCenter server
- /var/log/vpxa.log on an ESXi host
Troubleshooting steps. Review the vpxd.log for errors or exceptions during vCenter Server startup. Additionally, check the vpxa.log on managed ESXi hosts to ensure proper communication between vCenter and the hosts.
VMware High Availability (HA) cluster failover issue
Problem: Virtual machines fail to restart on other hosts in an HA cluster after an ESXi host failure.
Logs to check: /var/log/fdm.log
Troubleshooting steps. Analyze the fdm.log on the affected hosts to identify any errors or issues with the HA cluster. Look for heartbeat messages, the master host election process, and possible reasons for VM failover failures.
vMotion failure
Problem: VMware vMotion fails when attempting to migrate a VM between hosts.
Logs to check:
- /var/log/vmkernel.log
- /var/log/vobd.log
Troubleshooting steps. Inspect the vmkernel.log for vMotion-related messages and any network connectivity issues. Additionally, check the vobd.log for potential storage-related problems that might impact vMotion.
VMware Tools installation problems
Problem: VMware Tools installation fails on a virtual machine.
Logs to check: /vmfs/volumes/datastore_name/vm_name/vmware.log
Troubleshooting steps. Review the vmware.log within the VM for VMware Tools-related errors or installation messages.
When troubleshooting with VMware logs, it’s essential to correlate events across multiple logs to get a comprehensive understanding of the issue. Additionally, log analysis tools, such as VMware Aria Operations for Logs (formerly vRealize Log Insight), can help streamline the log review process and enable more efficient VMware troubleshooting in complex environments.
Troubleshooting Storage Issues
You can use VMware logs to identify issues with hard disk drives or solid-state drives, for example, if there are bad blocks on an HDD. To identify issues with hard disk drives (HDDs) or solid-state drives (SSDs) in a VMware environment, you can use various VMware logs to track and analyze storage-related events and errors.
- Review VMkernel logs (/var/log/vmkernel.log):
VMkernel logs provide low-level system information, including storage-related events. Look for messages indicating disk I/O errors or SCSI sense codes related to disk issues.
Error example: “Device I/O errors“, “Medium Error Detected” or “Uncorrectable error in data“
- Check storage-specific logs (/var/log/vobd.log):
The vobd.log contains storage-related messages, including errors encountered by the storage subsystem.
Error example: “Storage Error: Device ‘naa.xxxxxxxxxxxxxx’… Sense: Unrecovered read error“
- Examine virtual machine logs (/vmfs/volumes/datastore_name/vm_name/vmware.log):
Virtual machine-specific logs can reveal disk I/O errors encountered by a particular VM.
Error example: “Disk I/O error occurred on one or more virtual disks“, “Disk error detected” or “Error Stack: Unable to read partition table“
Recommendations: What to use in addition to VMware logs
There are recommendations of what to use with VMware logs for better and more detailed diagnostics and troubleshooting to detect storage issues in time.
- Monitor vCenter Alarms and Events. Keep an eye on vCenter Server alarms and events related to storage. Alarms triggered by storage issues can provide insights into potential disk problems.
- Use VMware Health Checks. VMware provides various health checks that can be performed through the vSphere Client. These checks can identify storage-related problems and offer recommendations.
- Utilize Third-Party Monitoring Tools. Implement special IT monitoring and log analysis tools to centralize and analyze log data from multiple hosts and VMs. These tools can help identify disk-related issues across the entire virtual infrastructure.
- When identifying bad blocks on HDDs, it’s essential to pay attention to various error messages and patterns, especially those indicating media or read/write errors. Bad blocks might lead to data corruption or performance degradation and early detection can prevent more severe issues. If data on failed disk devices is lost, data recovery from a VMware backup to healthy disks is essential.
Cluster Issues
Using VMware ESXi logs and vCenter logs can be instrumental in identifying cluster-related issues in your virtualized environment. Cluster issues may manifest as problems with VM performance, HA failovers, vMotion failures, or other cluster-related operations.
- Review vCenter Server logs:
- Access vCenter logs, such as vpxd.log and vpxa.log, located at /var/log/vmware/vpxd/vpxd.log and /var/log/vpxa.log respectively.
- Look for errors or warning messages related to cluster operations, resource management, and communication between vCenter and ESXi hosts.
- Pay attention to events during cluster creation, configuration changes, and issues with cluster services.
- Check ESXi host logs and access ESXi host logs, including vmkernel.log, hostd.log and fdm.log:
- vmkernel.log: Review to check for any cluster-related events, such as vMotion attempts, HA heartbeat issues, or errors during resource sharing.
- hostd.log: Look for cluster-related messages related to tasks and events handled by the host management service.
- fdm.log: Examine to check for HA-related events, including host failures, VM restarts, and master election events.
- Inspect virtual machine logs:
- Access VM logs, such as vmware.log, to identify issues specific to individual VMs in the cluster.
- VM logs can provide insights into VM performance, resource constraints, or failures during vMotion operations.
- Monitor cluster-specific alarms and events:
- Use vCenter to create alarms and events specific to cluster performance and health.
- Configure alarms for issues like excessive resource usage, cluster partitioning, or VM failures.
- Check vCenter’s Events tab for cluster-related events, such as VM migrations, cluster reconfigurations, or HA events.
By combining information from ESXi logs, vCenter logs, performance metrics, and cluster-specific events, you can gain a comprehensive understanding of cluster health and identify issues affecting virtual machine performance, high availability, and overall cluster stability. Regular log analysis and proactive monitoring can help prevent cluster issues or quickly resolve them when they occur.
Network Troubleshooting
Network troubleshooting in VMware vSphere involves identifying and resolving network-related issues affecting virtual machines and communication between ESXi hosts. VMware ESXi and vCenter logs can be instrumental in pinpointing such problems. Below are some examples of network troubleshooting using ESXi and vCenter logs, along with commands to extract relevant information.
Identifying VM network connectivity issues
Problem: A virtual machine is unable to access the network.
- A command to check VMkernel logs (on an ESXi host):
cat /var/log/vmkernel.log | grep -E 'Failed to send packet|dropped|no network'This command filters the VMkernel logs for messages related to packet failures, dropped packets, or network unavailability.
- A command to check VM network configurations (on an ESXi host):
esxcfg-vmknic -lThis command lists the configured VMkernel network interfaces and IP addresses on the ESXi host. Verify if the VM’s network is correctly configured.
Troubleshooting vMotion issues
Problem: vMotion fails between two ESXi hosts.
- A command to check VMkernel logs (on both source and destination ESXi hosts):
cat /var/log/vmkernel.log | grep -E 'Migration to host|vMotion'This command helps to find vMotion-related messages on both the source and destination ESXi hosts.
- A command to check vCenter events (on vCenter Server):
vim-cmd vmsvc/get.eventlog <vmid> | grep 'Migrate'Replace <vmid> with the Virtual Machine ID (VMID) of the affected VM. This command retrieves the event log for the VM and searches for vMotion-related events.
Identifying network performance bottlenecks
Problem: Virtual machines experience network performance degradation.
- A command to check ESXTOP statistics (on an ESXi host):
esxtopInside esxtop, press n to switch to the networking view. Monitor metrics such as Network Throughput (MBTx/rx), Network Packets/s, and Network Dropped/s to identify potential bottlenecks. This and the next commands are used to display data not from a VMware log file but display the real-time updated information for VMware troubleshooting. You can also see ESXi uptime by using the esxtop command.
Troubleshooting vSphere Distributed Switch (VDS) issues
Problem: Connectivity issues with VMs on a vSphere Distributed Switch.
- A command to check VDS health (on vCenter Server):
net-dvs -lThis command lists all distributed virtual switches (VDS) and their status.
- A command to check VDS port status (on vCenter Server):
net-dvs -p <VDS Name>Replace <VDS Name> with the name of the VDS. This command displays the status of all ports on the specified distributed virtual switch.
Remember, network troubleshooting often requires analyzing logs and performance data from multiple sources, including VMkernel logs, vCenter logs, performance metrics, and network configurations. The examples provided above serve as starting points to gather information relevant to network issues and you may need to adjust the commands based on the specific problem you encounter in your vSphere environment.
Regular Expressions for VMware Log Analysis
As you can see in the examples above, accessing ESXi shell via SSH and using the command line is a powerful method to view VMware logs and for VMware log analysis. You can use native command line tools as VMware ESXi log analysis tools. These command line tools are familiar to Linux users:
- cat is a command-line tool that concatenates and displays the contents of one or more text files on the terminal. It is commonly used to view the entire content of a file at once. However, for large files, using cat might result in an overwhelming amount of output scrolling off the screen quickly, making it less practical for reading such files.
- less is a command-line pager utility that allows you to view and scroll through the contents of a text file. It displays one screen of text at a time and provides navigation options to move forward and backward in the file. Unlike cat, which dumps the entire file content to the terminal, less is useful for reading large files more efficiently.
- grep stands for “Global Regular Expression Print”. It is a powerful command-line tool used for searching text patterns (regular expressions) in one or more files. grep can filter and display lines containing the specified pattern. It is commonly used for text searches, log analysis, and extracting specific information from files.
- tail is a command-line utility that displays the last few lines of a text file. By default, tail shows the last ten lines of the file. It is particularly useful for monitoring log files in real time, as it can display new entries as they are added to the log. The tail command is often used with the -f option to continuously monitor a file and see real-time updates.
- head is a command-line utility that displays the first N lines of a text file. By default, the head tool shows the first 10 lines of the file. It is helpful for quickly previewing the beginning of a file or extracting initial information. Similar to tail, you can specify the number of lines to display using the -n option.
You can use these command line tools together with each other and with regular expressions for the highest efficiency of VMware log analysis. Analyzing log files using regular expressions (regex) in the ESXi command line can be a powerful way to extract specific information and gain insights into issues or patterns. Below you can see some real practical examples of how to use regular expressions for log analysis in ESXi.
Filtering logs for specific events
Suppose you want to find all occurrences of a specific event, such as “Disk I/O error“, in the vmkernel.log file.
cat /var/log/vmkernel.log | grep -E 'Disk I/O error'
This command will display all lines containing the phrase “Disk I/O error” in the vmkernel.log.
Extracting IP addresses from logs
To extract IP addresses from logs in the hostd.log file, you can use a regex pattern that matches IPv4 addresses.
cat /var/log/hostd.log | grep -E -o '([0-9]{1,3}\.){3}[0-9]{1,3}'
This command will display all IPv4 addresses found in the hostd.log.
Finding patterns with quantifiers
Suppose you want to find all lines in the vmware.log file that contain any number of consecutive digits.
cat /vmfs/volumes/datastore_name/vm_name/vmware.log | grep -E '[0-9]+'
This command will display all lines containing one or more digits in the vmware.log.
Searching for multiple patterns
To find lines in the vpxd.log file containing either “error” or “warning“, you can use the OR operator | in the regex pattern.
cat /var/log/vmware/vpxd/vpxd.log | grep -E 'error|warning'
This command will display all lines containing either “error” or “warning” in the vpxd.log.
Matching with wildcards
Suppose you want to find all lines in the vobd.log file that contain the word “failed” regardless of the case.
cat /var/log/vobd.log | grep -i 'failed'
This command will display all lines containing “failed“, “FAILED“, “Failed“, etc., in the vobd.log.
Using capturing groups
To extract date and time information from lines in the sms.log file, you can use capturing groups in the regex pattern.
cat /var/log/vmware/sms/sms.log | grep -Eo '([0-9]{4}-[0-9]{2}-[0-9]{2}) ([0-9]{2}:[0-9]{2}:[0-9]{2})'
This command will display all occurrences of date and time in the sms.log.
NOTE: You can change the path to the needed log for your particular use case.
These examples demonstrate how to use regular expressions in combination with the grep command to perform log analysis in the ESXi command line interface. Regular expressions provide powerful pattern-matching capabilities, enabling you to extract specific information, filter logs, and find patterns efficiently. Keep in mind that the actual regex patterns may vary depending on the log file’s content and the information you want to extract or search for. You can use these examples and tune the commands to meet your specific needs for VMware log analysis.
How to Export VMware Logs and Download Support Bundle
It may happen that VMware log analysis doesn’t help you resolve issues that occurred on an ESXi host or vCenter. In this case, you can export logs or download a support bundle and send this information to VMware support. Specialists from VMware support can help you resolve issues with the VMware environment if you have a licensed version of VMware vSphere.
VMware Host Client
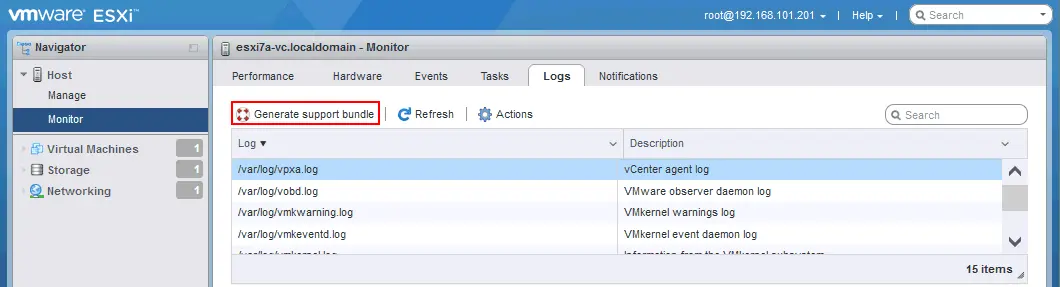
To generate a support bundle and export VMware logs, perform the following steps:
- Click Monitor in the Navigator pane.
- Select the Logs tab.
- Click Generate support bundle.
- Save the bundle archive downloaded in your web browser.
VMware vSphere Client
To export VMware system logs in vSphere Client, do the following:
- Select the Hosts and Clusters view and select the ESXi host which logs you want to export (in the left pane, which is the navigation pane).
- Right-click the ESXi host and click Export system logs in the menu that opens.

- Select which ESXi logs you want to export and click Export logs.

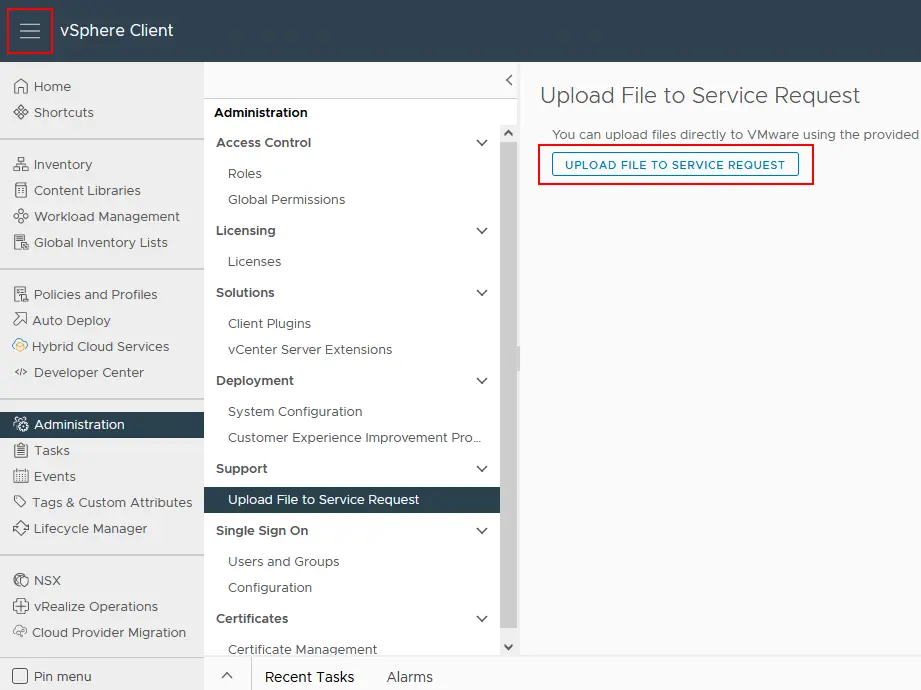
To upload the bundle to VMware support in vSphere Client, do the following:
- Click the Menu icon in the top left corner.
- Go to Administration > Support > Upload File to Service Request and hit the Upload File to Service Request button.
Link in a web browser
Use the link to the cgi script on the ESXi host:
http://<ESXi_IP_address>/cgi-bin/vm-support.cgi
Download and save the bundle with exported ESXi logs (a .tgz file).
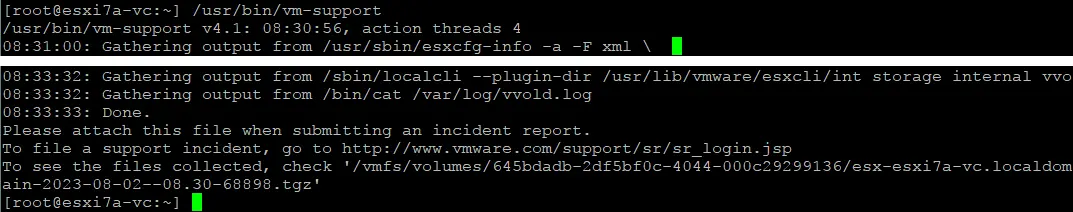
Generate a bundle in ESXi shell (command line)
You can run the command to generate a support bundle containing ESXi logs in ESXi shell with the command:
/usr/bin/vm-support
Conclusion
When troubleshooting issues with VMware vSphere, including ESXi and vCenter, analyzing VMware logs can help administrators identify the root cause of problems and take appropriate corrective actions. By analyzing these logs, administrators can identify and address issues such as performance bottlenecks, connectivity problems, configuration errors, and potential security concerns. Regular log review is essential for proactive management and maintaining the stability and reliability of VMware vCenter and the virtualized environment.
Regular monitoring of the VMware infrastructure and VM backup allows you to prevent issues in time and avoid data loss.