Using VM Performance Monitoring to Boost VM Performance
Virtualization is widely used nowadays due to the advantages for business IT infrastructures, such as scalability, cost-efficiency, and convenient administration. Hardware resources of physical servers can be aggregated to resource pools and provisioned for virtual machines (VMs). Sufficient resources allocated to VMs are required for the expected performance of a guest operating system and applications running on the VM. When you run a high number of VMs, some of them may need additional resources and some may use more resources than needed. Insufficient resources for a VM causes performance degradation.
In this post, we explain why monitoring is important and how this feature helps you improve VM performance with a focus on VMware vSphere monitoring.

What Is Virtual Machine Monitoring
Virtual machine monitoring is the process of tracking VM parameters such as processor, memory, disk, network usage, etc. You can also monitor the VM availability status. Advanced monitoring features also allow you to monitor applications running on the VM. The real-time and historical counters’ data can be saved for comprehensive analytics by monitoring tools.
VM Monitoring Features
VM monitoring differs from monitoring other IT infrastructure components, such as physical computers. Virtual machines consume hardware resources in a different way than physical machines. VMs access resources by passing the abstraction hypervisor layer. For this reason, you need to monitor particular VMs or the entire VM infrastructure at the host level and not at the guest OS level. That’s why, to get accurate data, you cannot install a monitoring application at the guest OS of a VM.
What to monitor
Memory and hard disk. VMs can grow during operation. Memory overflow or lack of disk space can be reasons for VM failure. You should monitor free storage space, especially when using thin-provisioned virtual disks. If there is enough free disk space, but disks are used intensively, the performance of VMs using those disks can degrade. VM monitoring helps you make the right decision and migrate VMs to another storage for better performance.
Provisioned resources. VM sprawl (virtualization sprawl) can lead to inefficient VM management because of a lack of resources on a server. This can happen when you have many unused (unnecessary) VMs consuming disk space, CPU and memory. Another common issue is overprovisioning. This situation occurs when the amount of provisioned resources for VMs exceeds the available hardware capability. You should monitor VM infrastructure, especially if resources are overcommitted and resource allocation exceeds the available capacity on a physical server.
VM monitoring advantages
VM monitoring helps you:
- Identify performance bottlenecks more quickly
- Receive alerts to prevent potential failures proactively
- Smartly troubleshoot performance issues, for example, decide whether to allocate more RAM to a VM or install more RAM in the host
- Perform insights-led capacity planning that anticipates future needs and avoids resources’ draining
- Save time and replace tedious manual monitoring commands with real-time dashboard gauges that span the entire virtual infrastructure
- Distribute loads effectively between hosts, improve VMs performance, and optimize server performance
How to Monitor VMware VMs?
You can check some information about ESXi hosts, datastores, and virtual machines, including their state and resource consumption, using built-in VMware functionality or a special monitoring solution.
Built-in VMware Monitoring Tools
The most affordable method of vSphere monitoring is using vCenter built-in tools in VMware vSphere Client. Let’s look at how to monitor VMware ESXi health and VM performance using native tools.
ESXi hardware health
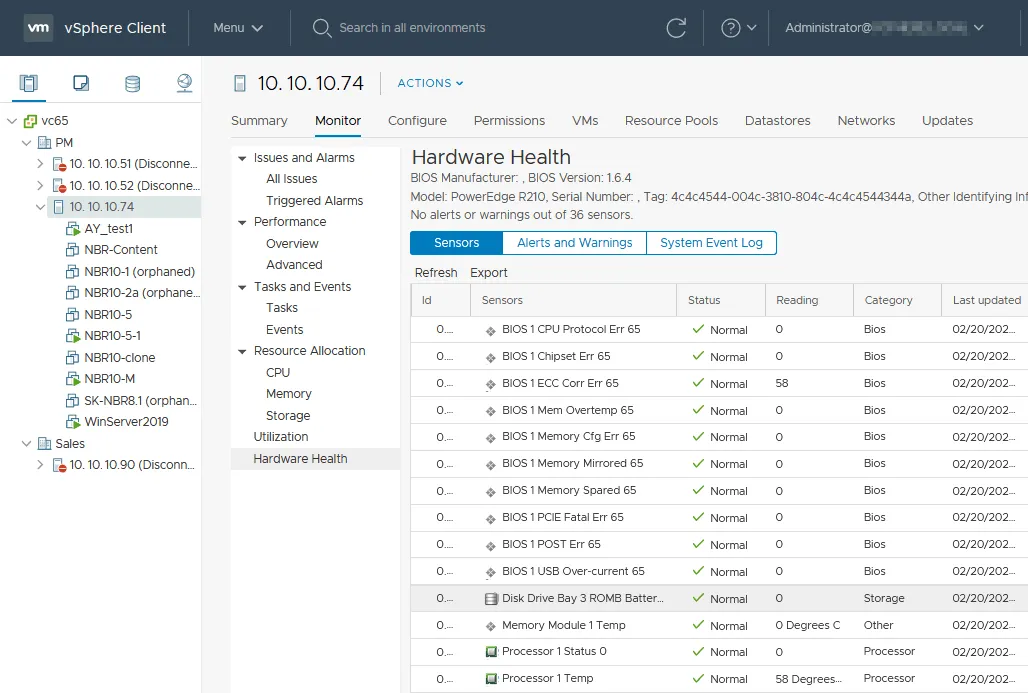
You can follow these simple steps to monitor VMware vSphere parameters:
- Click the needed ESXi host to see the main information.
- Click the Monitor tab.
- Select the needed monitored parameter to see detailed information, for example, Hardware Health. There are sensors on the server hardware that display information about CPU temperature, motherboard temperature, fan speed (RPM), etc.
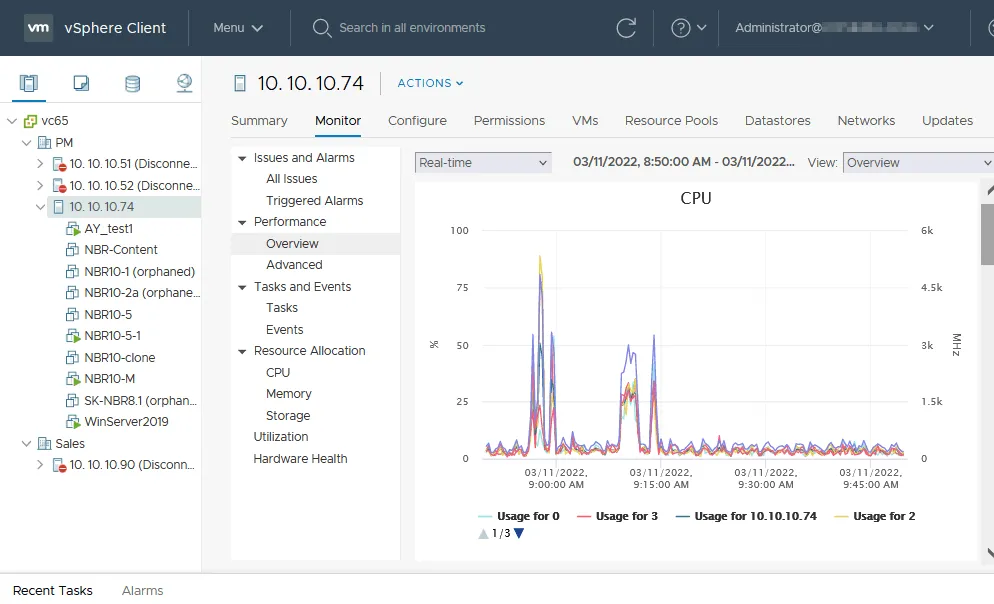
Monitoring ESXi performance
To monitor ESXi performance:
- Select an ESXi host in VMware vSphere Client.
- Click the Monitor tab.
- Go to Performance & Overview. The information about CPU in real time is displayed in the screenshot below for the selected ESXi host. The graph view allows you to analyze the CPU workload for the selected period.
- Scroll down the page to see information about memory, disk, and network utilization for vSphere performance monitoring.
- Go to Performance & Details to view more information about the needed parameter.
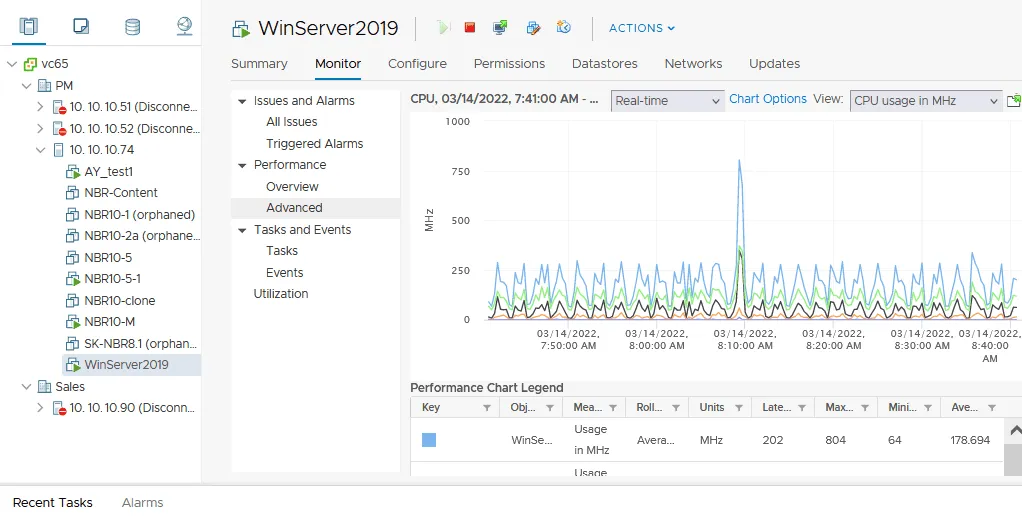
Virtual machine monitoring in vSphere
It is recommended that you install VMware Tools in the guest operating system of a VM to get accurate VM monitoring information.
- Select a VM to view information about that VM.
- Select the Monitor tab, similarly as explained for an ESXi host for VM performance monitoring. Select the needed VMware monitoring parameter for the VM. In this example, we go to Performance & Advanced and select to monitor VM CPU usage in MHz.
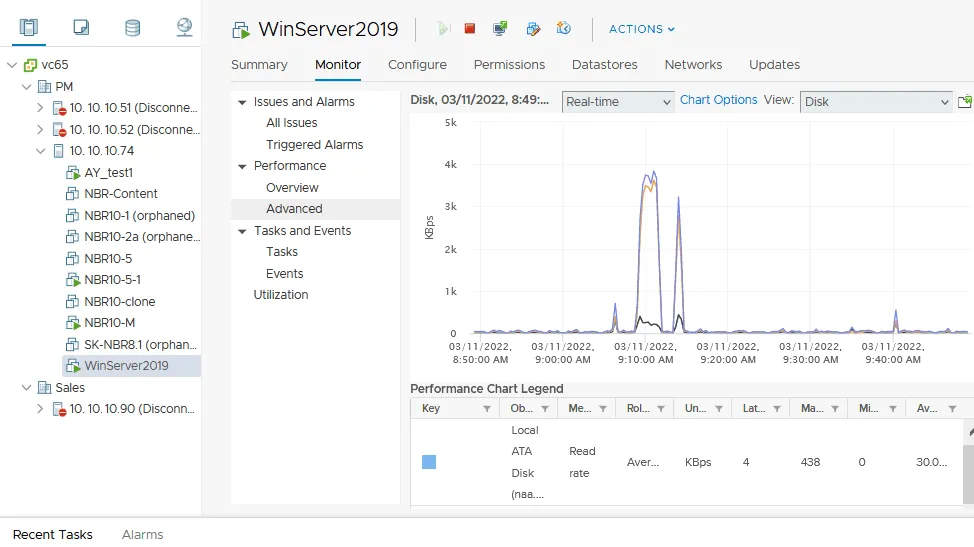
How do I monitor IOPS in VMware vSphere?
Monitoring IOPS (input/output operations per second) allows you to check storage performance for a virtual machine.
- Select a virtual machine in VMware vSphere Client.
- Click the Monitor tab.
- Go to Performance & Advanced.
- In the View drop-down menu, select Disk.
The screenshot shows the virtual disk performance graph (KBps).
Using a dedicated monitoring solution
You can use a special monitoring solution to monitor multiple vCenter servers, ESXi hosts and their resources from a single pane of glass. This VMware monitoring functionality is supported in NAKIVO Backup & Replication, a universal all-in-one data protection solution.
- You need to have your vCenter servers and ESXi hosts added to the inventory.
- Go to the Monitoring section in the left pane of the web interface.
- Click Add Monitored Items.

- Select particular VMs, ESXi hosts, or the entire vCenter servers you want to monitor. In our example, we select to monitor one ESXi host and all VMs residing on this host.
Note. The Items view is selected by default, but you can select the policy view and select VMware vSphere items matching your policy.
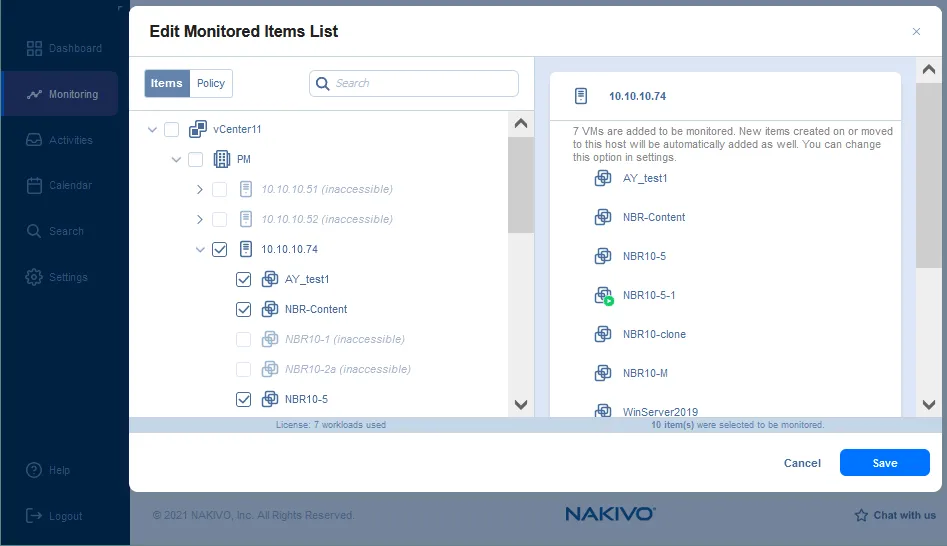
- Once you select a checkbox at the ESXi host, the confirmation message is displayed to select all VMs on that host:
Do you want to monitor all child VMs?
Click Apply to confirm.

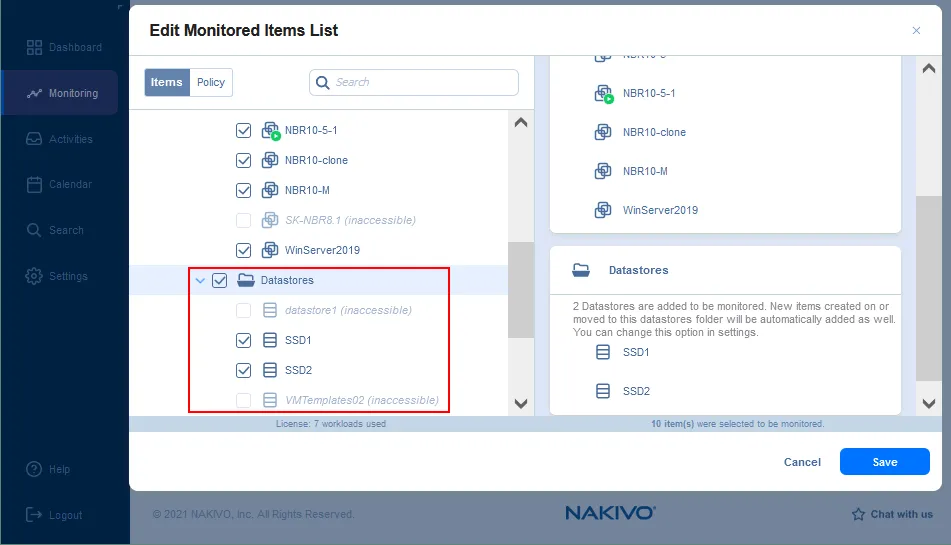
- Scroll down the monitored items list and select the datastores you want to monitor.
- Click Save to save VM monitoring settings.
Now you can click the Monitoring button in the left pane of the NAKIVO web interface, select the needed items for VMware monitoring, and view the provided information.
Let’s select the ESXi host and check CPU load, memory load, and their graphs. There are no performance issues in this case.
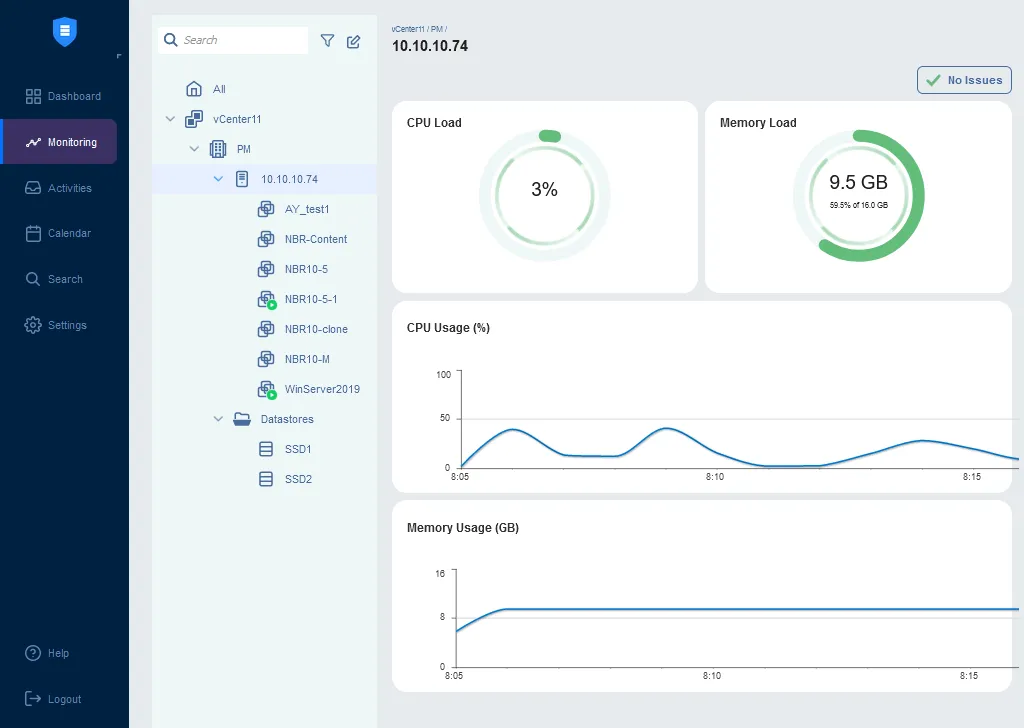
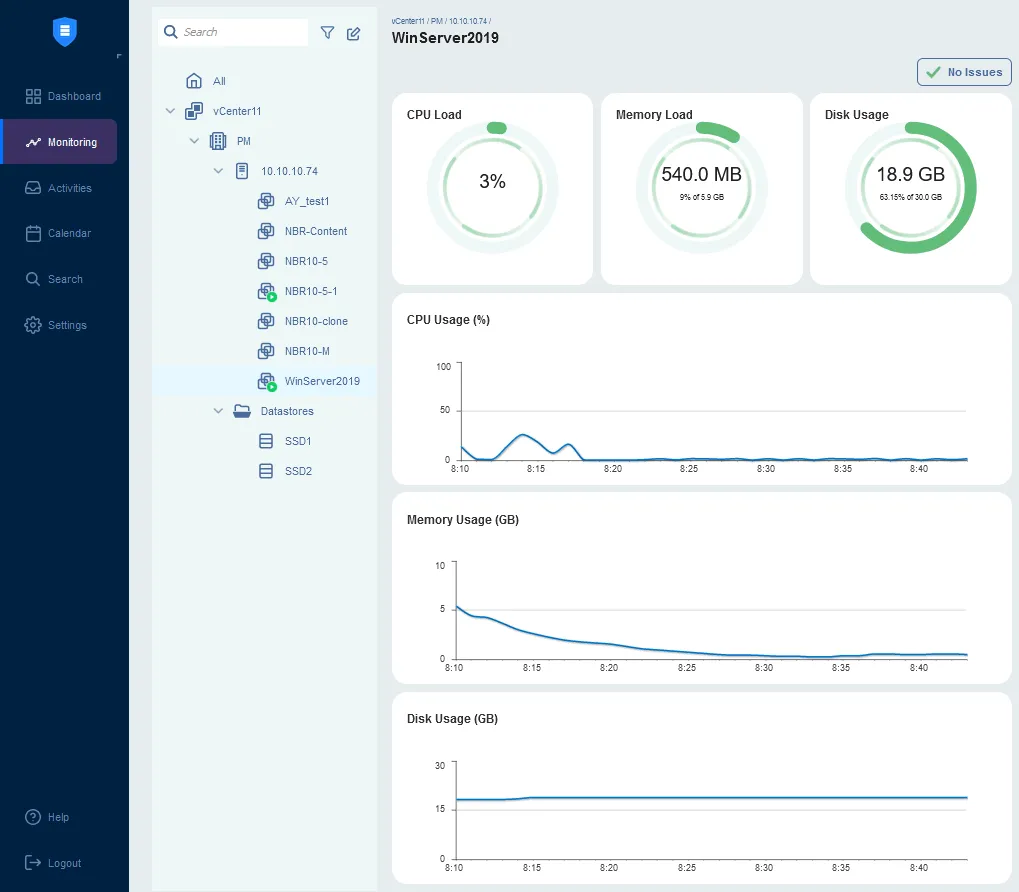
You can click an individual VM to check the current CPU load, memory load and disk usage in the corresponding pie charts or view the statistics in the line graphs over a period of time.
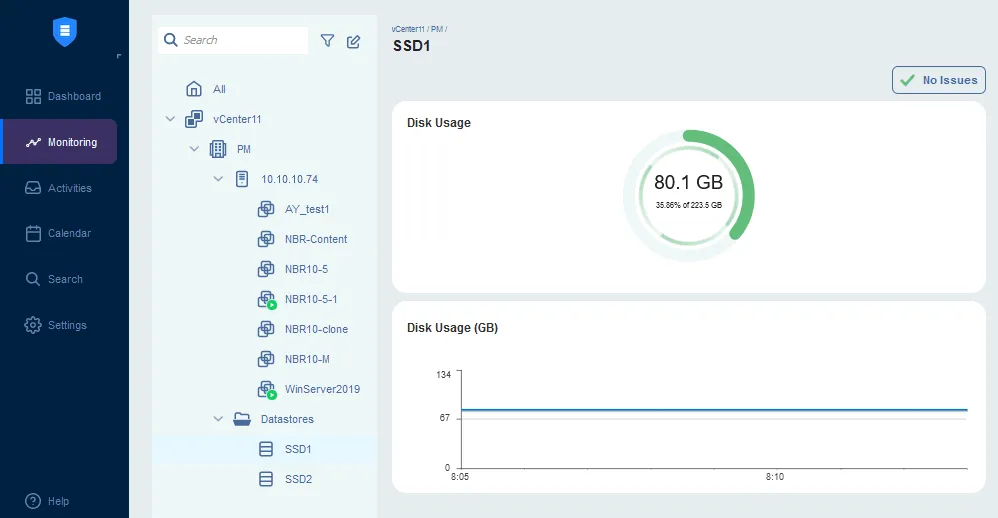
Click a datastore to check disk usage on an ESXi host.
See all features and compare editions of NAKIVO Backup & Replication.

Conclusion
VM performance monitoring is useful for optimizing your VMware infrastructure, detecting VM issues in time, and understanding which settings to tune for performance optimization. You can use native VMware monitoring tools or a third-party solution. Determine which metrics you want to monitor. Select the needed software depending on your requirements and don’t forget about VMware backup for VM data protection.