Tips and Tools for Microsoft Hyper-V Monitoring
The main advantages of hardware virtualization include logical isolation and rational resource usage. When using Microsoft Hyper-V, it is important to monitor hardware resources usage by virtual machines and physical Hyper-V servers. Insufficient or excess resources allocated to a VM can lead to VM performance degradation or can affect the performance of other VMs and the entire environment. This blog post covers Hyper-V monitoring tips and native Hyper-V monitoring tools that are available to you for free.

Why Do You Need Hyper-V Performance Monitoring?
Hyper-V resource monitoring allows you to detect bottlenecks, and manage resources to optimize performance. By monitoring Hyper-V performance, you view statistics about resources to help you make decisions on matters like: provisioning more resources on the current Hyper-V host, re-configuring software on a VM, or migrating a VM to another Hyper-V host. Note that SNMP (Simple Network Management Protocol) has been deprecated for monitoring Hyper-V hosts.
If you detect low VM performance, use the following questions to narrow down the possible causes:
- Are there enough resources allocated to a VM running on a Hyper-V host?
- Are there enough free hardware resources on a Hyper-V host?
- Do performance issues exist on one VM or multiple VMs?
Fortunately, Hyper-V has some free native tools to monitor performance and resource consumption starting from the GUI of a Hyper-V Manager. If you want to automate VM migration across Hyper-V hosts for load balancing, there is basic functionality to do this within a cluster. Keep in mind that if you use a Hyper-V cluster, you need SCVMM (System Center Virtual Machine Manager), which is a paid solution, to migrate VMs automatically to optimize resource usage of Hyper-V servers and perform load balancing. Hyper-V replication monitoring can be also done in SCVMM.
Don’t Use Windows Task Manager to Monitor Resources Inside VMs
Opening Task Manager is a fast and easy method to view performance and resource usage on physical computers running Windows. However, don’t use Windows Task Manager to monitor performance inside a VM. Windows Task Manager doesn’t show real usage of CPU and memory by a virtual machine. This is because the Task Manager doesn’t identify machines as being virtual and cannot know how resources are provisioned to a VM. Use Task Manager to monitor running processes, services, and applications, but not to monitor performance inside VMs.
Use Performance Monitor on a Hyper-V Host
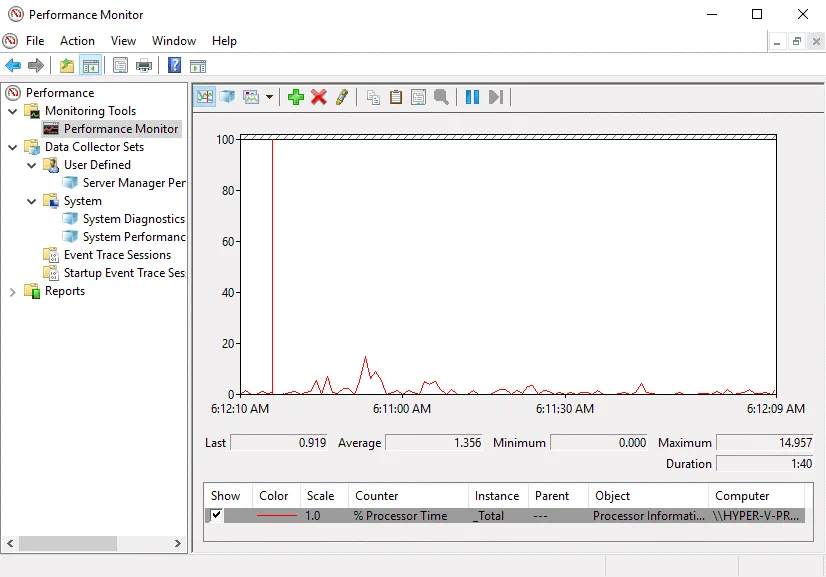
Use Performance Monitor (perfmon) on a Hyper-V host and the appropriate counters to monitor utilization of a processor, memory, interface, physical disk, and other hardware. The perfmon utility is widely used for performance troubleshooting on Windows systems.
Run perfmon in run dialog box or find Performance Monitor in the Computer Management window, add needed counters, and monitor statistics in the graphical user interface (GUI). The information collected can be displayed as charts, graphs, and diagrams.
It may be also useful to open Resource Monitor on a Hyper-V host (resmon.exe).
Use Counters for Hyper-V
Performance Monitor can provide incorrect information for virtual machines running on a Hyper-V host because standard (normal) counters are not adapted for VM monitoring. Imagine that a physical computer running Hyper-V has a processor with four cores, and two VMs are residing on the Hyper-V host. Four virtual processors are provisioned for the first VM. An application that loads four virtual processors at 100% is running on the first VM and consumes all processor resources on the physical Hyper-V host.
At the same time, you start the second VM on this Hyper-V host that has the same configuration of virtual devices and run the same application. Inside both virtual machines you see information that the processors of each VM are loaded at 100%. However, the applications on each VM are working at 50% of the speed comparing to the first case when only one VM was running (if you open Task Manager or Performance Monitor inside VMs). Information about memory is displayed similarly if dynamic memory is enabled.
Use Hyper-V-specific counters in Performance Monitor on a Hyper-V host to monitor resources on this Hyper-V host. Hyper-V counters display the most accurate information for Hyper-V performance monitoring.
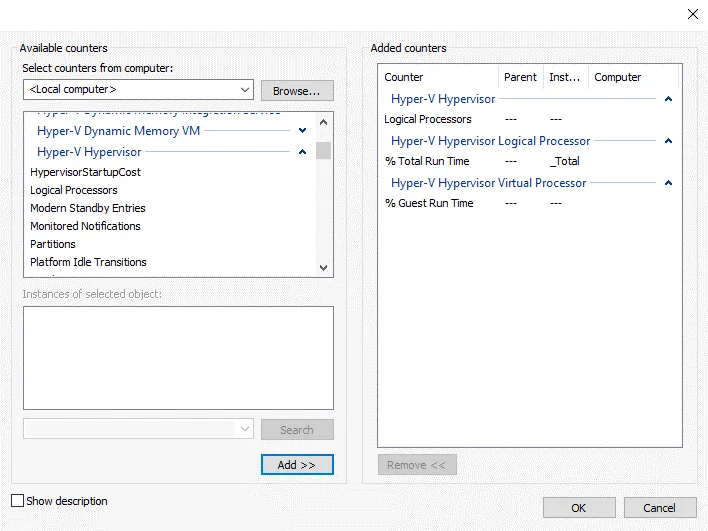
Processor performance
Use this counter to monitor physical processor performance on a Hyper-V host: Hyper-V Hypervisor Logical Processor% Total Run Time
The counter to monitor performance of virtual processors of a VM: Hyper-V Hypervisor Virtual Processor% Guest Run Time
- Optimal performance is when the counter displays a value of 75% or less for a running VM.
- A value in the 75 – 85% range is a warning.
- For a value higher than 85%, it is recommended that you investigate the reason for such high CPU usage.
The counter to monitor root virtual processor utilization: \Hyper-V Hypervisor Root Virtual Processor(*)\% Total Run Time
Memory utilization
There are multiple counters for Hyper-V monitoring and checking how much RAM is used.
The MemoryAvailable Mbytes counter on a Hyper-V host is used to monitor memory usage.
- Over 10% of free RAM – Healthy
- Under 10% of free RAM – Warning
- Under 100 MB of free RAM – Critical
Use the MemoryCommitted Bytes counter to check how much memory VMs use to define how much memory should be allocated for each VM.
Use the \Hyper-V Dynamic Memory Balancer\Average Pressure counter to monitor dynamic memory.
- Under 80% – Healthy
- Over 80% – Warning
- 100% – Critical
Disk latency
Use the \LogicalDisk(*)\Average Disk Sec\Read or Write counters to monitor disk latency that is important for overall performance of VMs running on Hyper-V.
- <10 ms (0.010 s) – OK
- >15ms (0.015 s) – Warning
- >25 ms (0.025 s) – Critical
Networking
Use the \Network Interface (*)\OutputQueue Length counter to monitor network usage, that is, it measures the number of network packets in the output packet queue.
- Less than 1 on average – Healthy
- Above than 1 on average – Warning
- More than 2 on average – Critical
Also consider using these counters:
Network Interface (network adapter name)\Bytes/sec
Hyper-V Virtual Network Adapter (virtual machine name )\Bytes/sec
Provide Enough Memory for VMs
Each machine requires enough memory for proper work, otherwise performance is degraded, the swap file is used intensively (if configured) and the disk is overloaded. In addition, swap files work slower than RAM. If an operating system and application consume about 12 GB of physical memory, install 16 GB of RAM into a computer. Use the same approach for VM memory allocation. For example, if software running on a VM consumes 6 GB of RAM, provide 8 GB of RAM for the VM. Provide at least 20% of additional memory for proper work. It is recommended that you provide extra memory as a buffer.
Use Event Viewer to Monitor Logs
Use Event Viewer to monitor logs on Hyper-V hosts and guest VMs that is useful for troubleshooting. Viewing and analyzing logs such as system events and application events can help determine issues and find a correct solution to fix them. Event Viewer shows error logs related to applications and works at the operating system level. To open Event Viewer, you should open Computer Management first.
Hyper-V logs are located in:
Event viewer > Applications and services logs > Microsoft > Windows
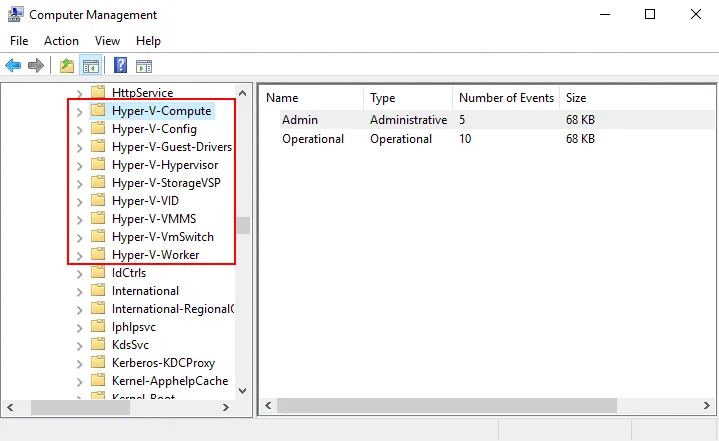
These are the Hyper-V logs categories in Event Viewer:
- Hyper-V-Compute
- Hyper-V-Config
- Hyper-V-Guest-Drivers
- Hyper-V Hypervisor
- Hyper-V-StorageVSP
- Hyper-V-VID
- Hyper-V-VMMS
- Hyper-V-VmSwitch
- Hyper-V-Worker
In Computer Management you can manage Windows services. It is recommended that you monitor the following Hyper-V services:
- Hyper-V Image Management Service (vhdsvc)
- Hyper-V Virtual Machine Management (vmms)
- Hyper-V Networking Management Service (nvspwmi)
Monitor Resources in PowerShell
You can monitor resources of Hyper-V hosts and virtual machines in PowerShell. This is particularly useful with a non-GUI Windows OS. Use special cmdlets to monitor performance in PowerShell.
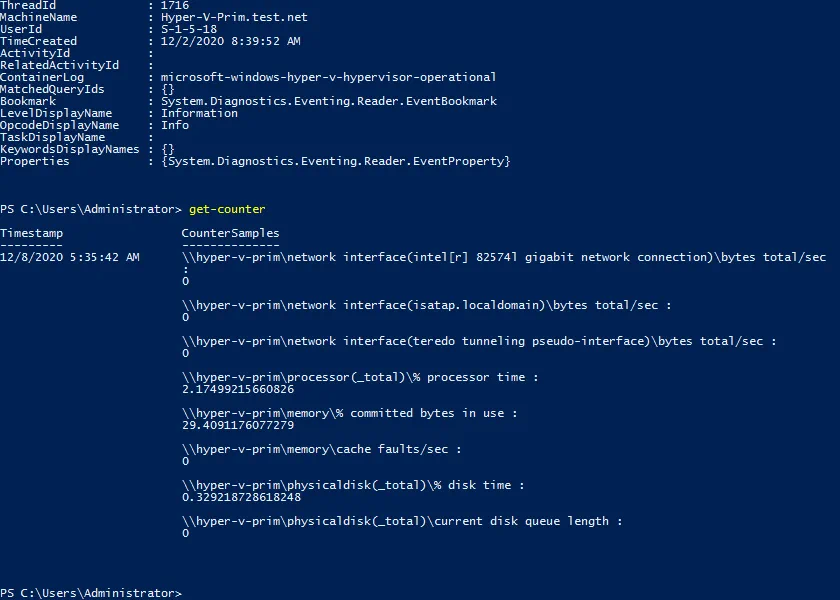
View operational logs of Hyper-V by interacting with Windows Event Log:
Get-WinEvent -LogName Microsoft-Windows-Hyper-V-Hypervisor-Operational | select -First 1 | Format-List *
This command interacts with performance counter objects on a Hyper-V host or guest VM and allows you to get data directly from remote or local machines by using Windows monitoring functionality:
Get-Counter
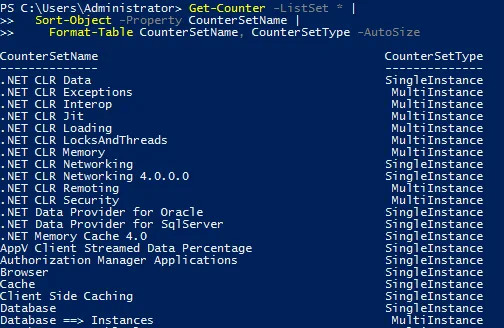
Get the counter list set and sort displayed results:
Get-Counter -ListSet * |
Sort-Object -Property CounterSetName |
Format-Table CounterSetName, CounterSetType -AutoSize
Monitoring performance of disks operating on multiple machines:
$DiskReads = “\LogicalDisk(C:)\Disk Reads/sec”
$DiskReads | Get-Counter -ComputerName Server01, Server02 -MaxSamples 10
You can create custom scripts for Hyper-V performance monitoring in PowerShell.
Conclusion
Hyper-V monitoring helps you determine whether VM performance issues are related to Hyper-V hosts or guest VMs. Hyper-V performance monitoring allows you to optimize hardware resources usage on a Hyper-V host. Some tools, such as Windows Task Manager, used to monitor physical hosts are not suitable to monitor performance of VMs running on Hyper-V. Performance Monitor includes Hyper-V specific counters adopted to monitor resources of Hyper-V hosts and VMs. You can use a Hyper-V Manager, Event Viewer, and Resource Monitor if you use the GUI, and special commands in PowerShell if you use the command line interface.
If functionality of native tools is not enough for you, try to use other Hyper-V monitoring software. Monitoring can help you optimize Hyper-V performance, but it can’t protect you from data loss when disaster strikes. Consider reliable Hyper-V backup software to protect you data. Download NAKIVO’s Free Edition to get multi-platform support, ransomware recovery and more.